
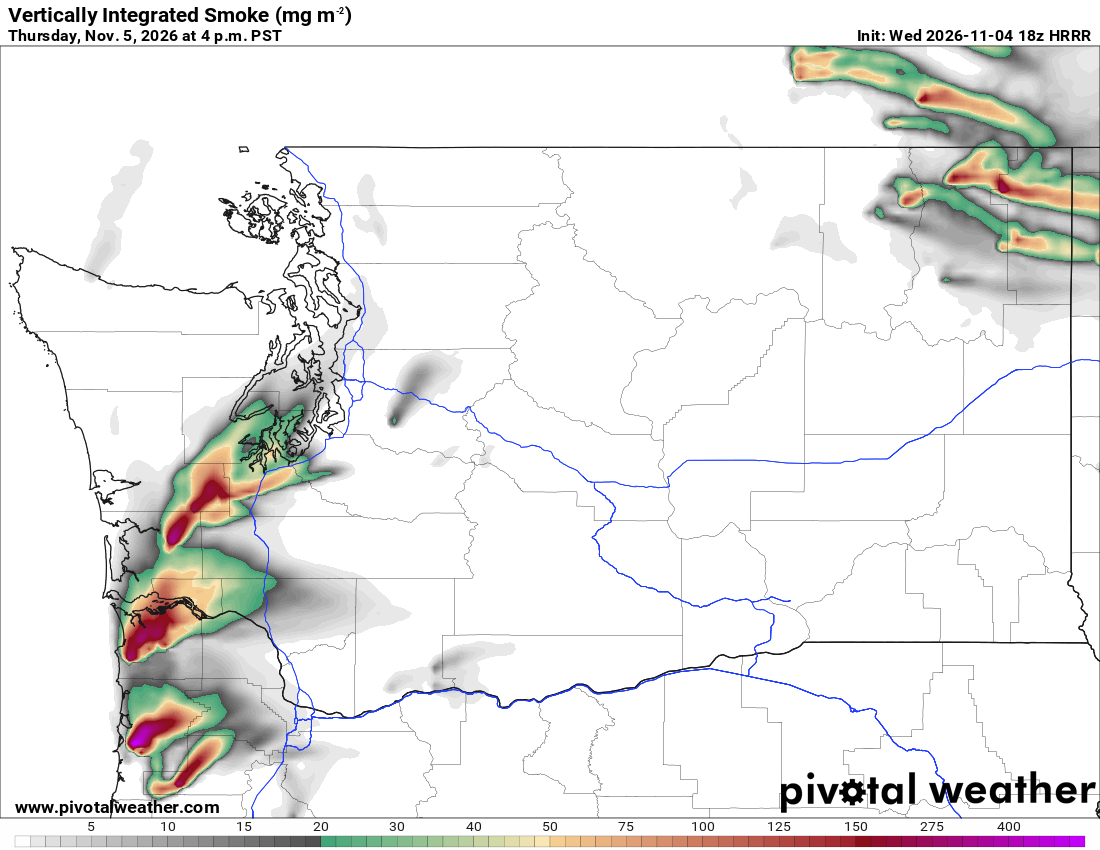
What the map shows
Where modeled smoke is transported through the atmosphere, including smoke well above the ground. Compare this with near-surface smoke to distinguish smoke aloft from smoke near breathing level.
How to read the colors
White indicates little or no modeled smoke. Gray shows lighter column totals, green higher totals, and yellow, orange, red and purple progressively heavier totals. Use the mg/m² scale below the map.
Common mistakes
- Assuming smoke overhead means equally smoky air at the surface.
- Reading the map as an air-quality index or a health advisory; use official air-quality observations and guidance.