
Back to Learning Center

Learning Center / Model Parameters / Surface & Precipitation

2 m Dewpoint

How much moisture is in the air near the ground.

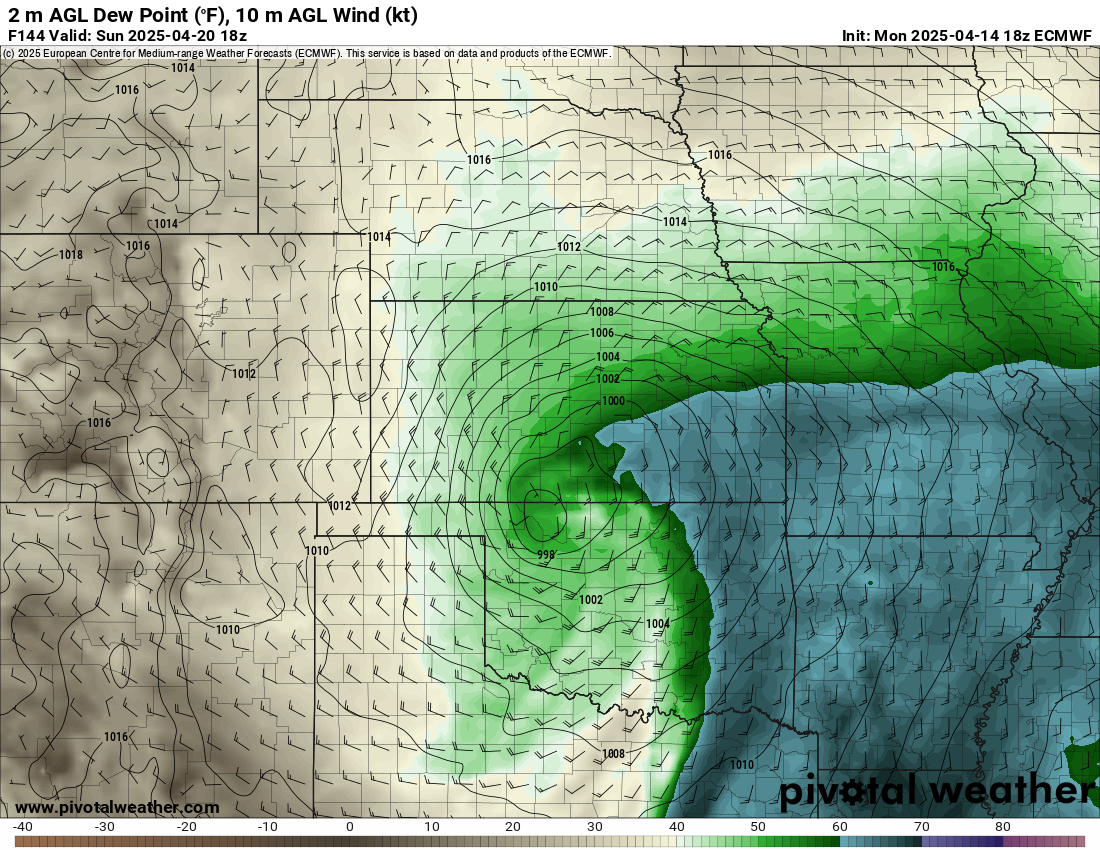
ECMWF dew point map of the central United States showing 60s and 70s dew points surging north into Oklahoma and Kansas ahead of a low pressure system, with wind barbs and pressure contours
2 m dew point (°F) with 10 m wind (kt) and pressure contours, showing rich Gulf moisture drawn north ahead of a Plains low, from the ECMWF model. Init: Mon 2025-04-14 18z, valid Sun 2025-04-20 18z.

What the map shows

Where it will feel humid, and where enough moisture exists to fuel storms.

How to read the colors

Browns are dry; greens are humid (60s °F); darker greens and blues are very humid (70s °F).

Common mistakes

  • Confusing dewpoint with relative humidity.
  • Trusting models that over-mix moisture on hot afternoons.

Key terms

Open in Pivotal Weather