
Back to Learning Center

Learning Center / Model Parameters / Surface & Precipitation

Precipitable Water

Total moisture in the air column.

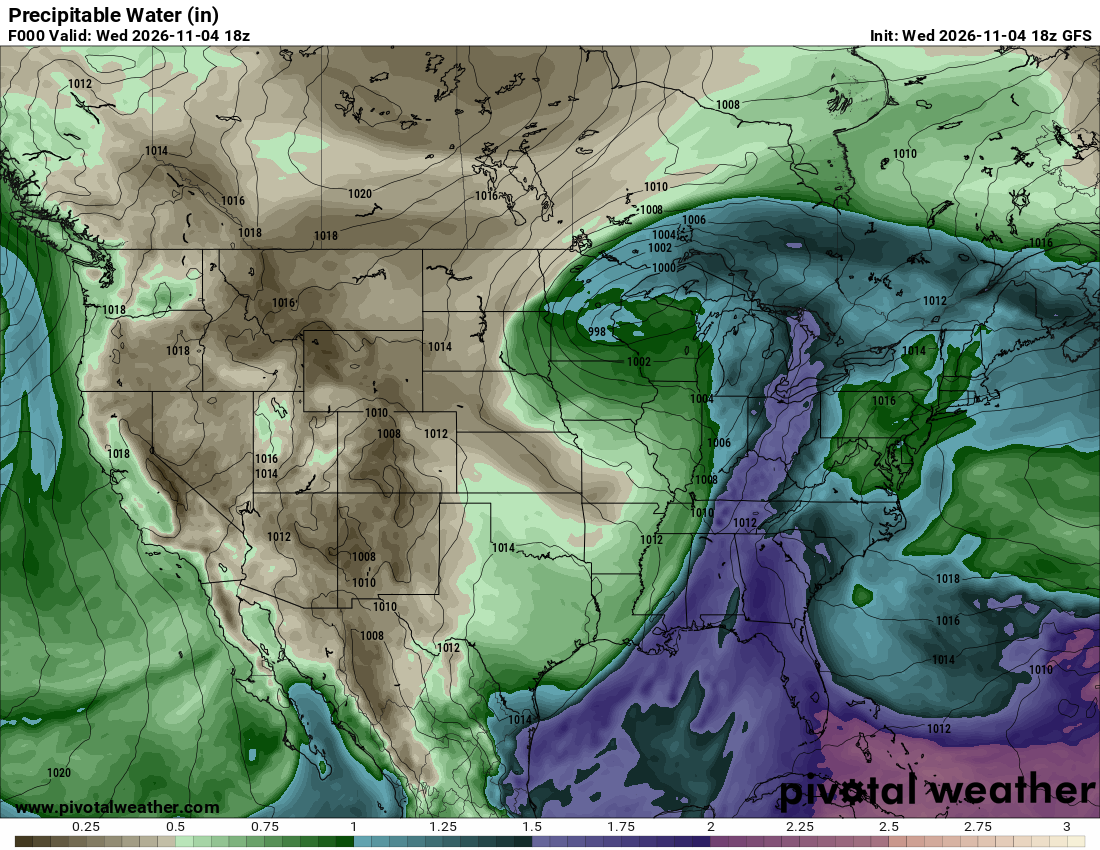
GFS precipitable water map showing a moist corridor from the Gulf of Mexico into the eastern United States and drier air across the West
Precipitable water (in) with sea-level pressure contours, from the GFS model. Init and valid: Wed 2026-11-04 18z (forecast hour 0).

What the map shows

How much moisture storms have to work with; signals flood potential.

How to read the colors

Browns are dry; greens moderate; blues and purples very moist (2+ inches).

Common mistakes

  • Assuming high PWAT alone means rain — you still need lift.

Key terms

Open in Pivotal Weather