
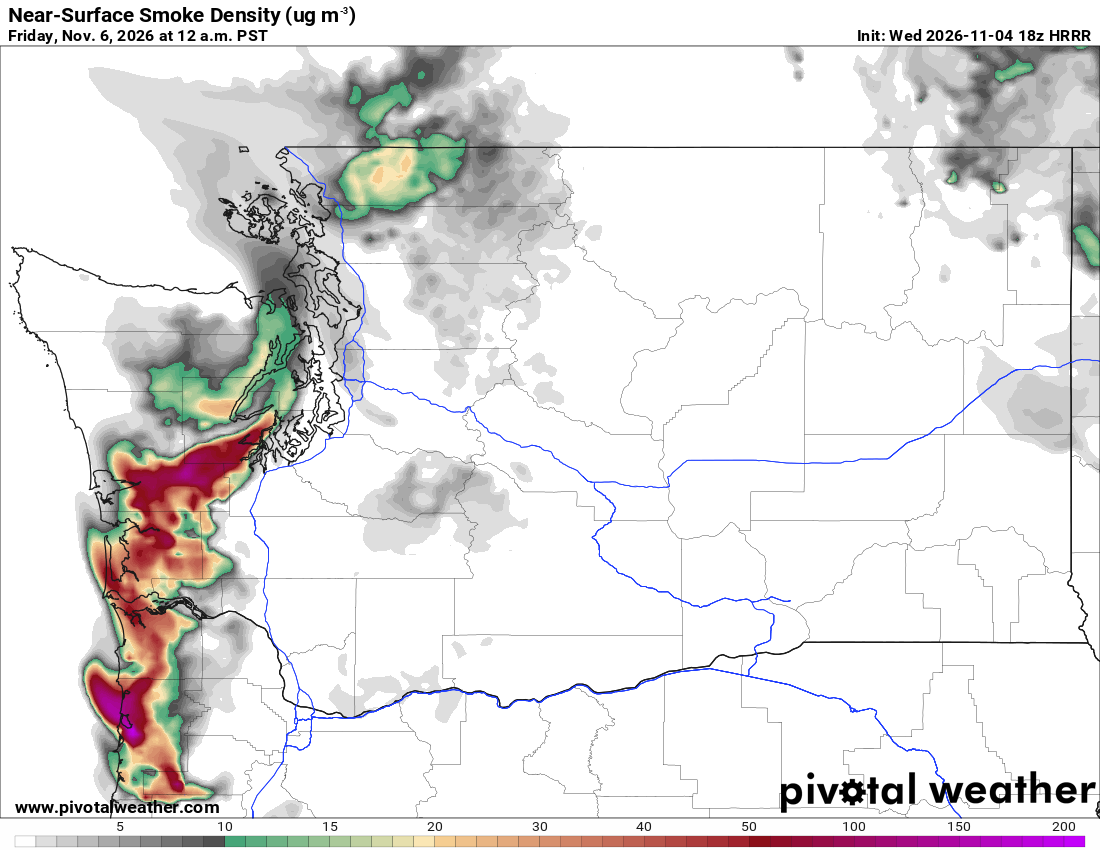
What the map shows
Where smoke may affect near-ground air and visibility. This differs from vertically integrated smoke, which includes the whole column. Forecasts depend on fire emissions, wind and atmospheric mixing.
How to read the colors
White indicates little or no modeled smoke. Gray and green show lower concentrations, with yellow, orange, red and purple indicating progressively higher concentrations. Read values from the µg/m³ scale.
Common mistakes
- Treating the forecast as a measured air-quality index or a direct health recommendation.
- Assuming fire emissions and local valley smoke are modeled perfectly; compare with current observations.