
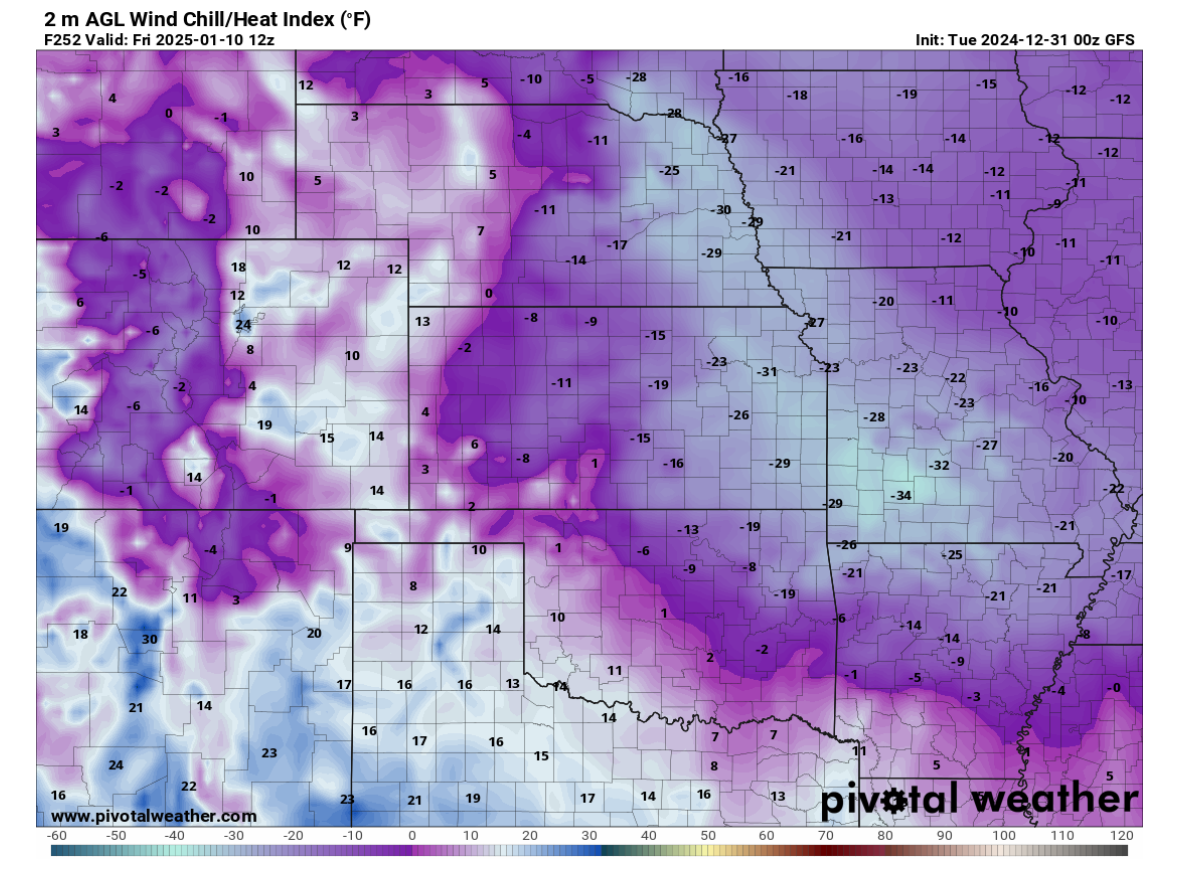
What the map shows
Wind chill in cold weather and heat index in hot, humid weather.
How to read the colors
Deep blues and purples for dangerous cold. For heat, colors run red, then brown, then grey as the danger climbs.
Common mistakes
- Planning around actual temperature when the feels-like value is what affects safety.