
Back to Learning Center

Learning Center / Model Parameters / Surface & Precipitation

QPF (Precipitation Totals)

Liquid precipitation expected over a chosen window.

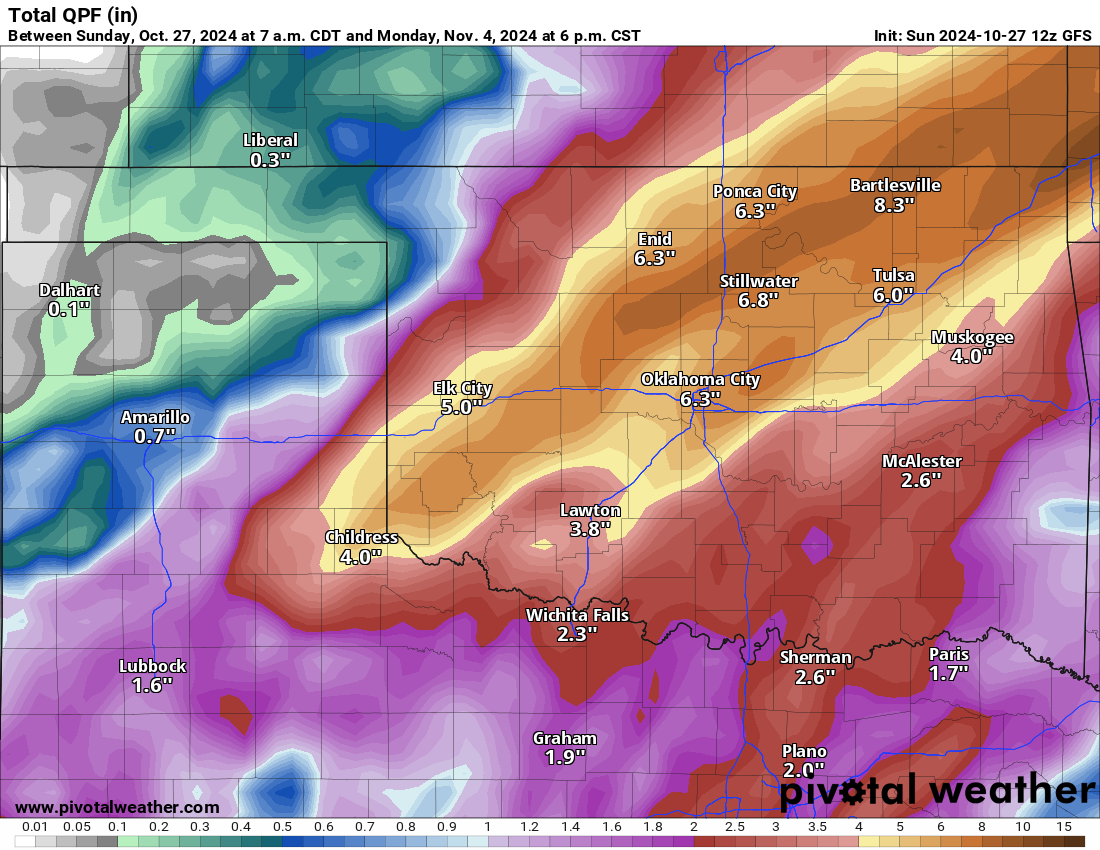
GFS total precipitation map of Oklahoma and the Texas Panhandle showing a band of 5 to 8 inches of rain across central and northeastern Oklahoma
Total QPF (in), from the GFS model. Init: Sun 2024-10-27 12z, accumulation between Sun 2024-10-27 7 a.m. CDT and Mon 2024-11-04 6 p.m. CST.

What the map shows

How much rain, or melted snow and ice, is expected over time.

How to read the colors

Greens for light amounts, yellows and oranges for 1–2 inches, reds and purples for heavy totals.

Common mistakes

  • Trusting exact placement of heavy bullseyes days in advance.
  • Forgetting it includes snow and ice as liquid.

Key terms

Open in Pivotal Weather