
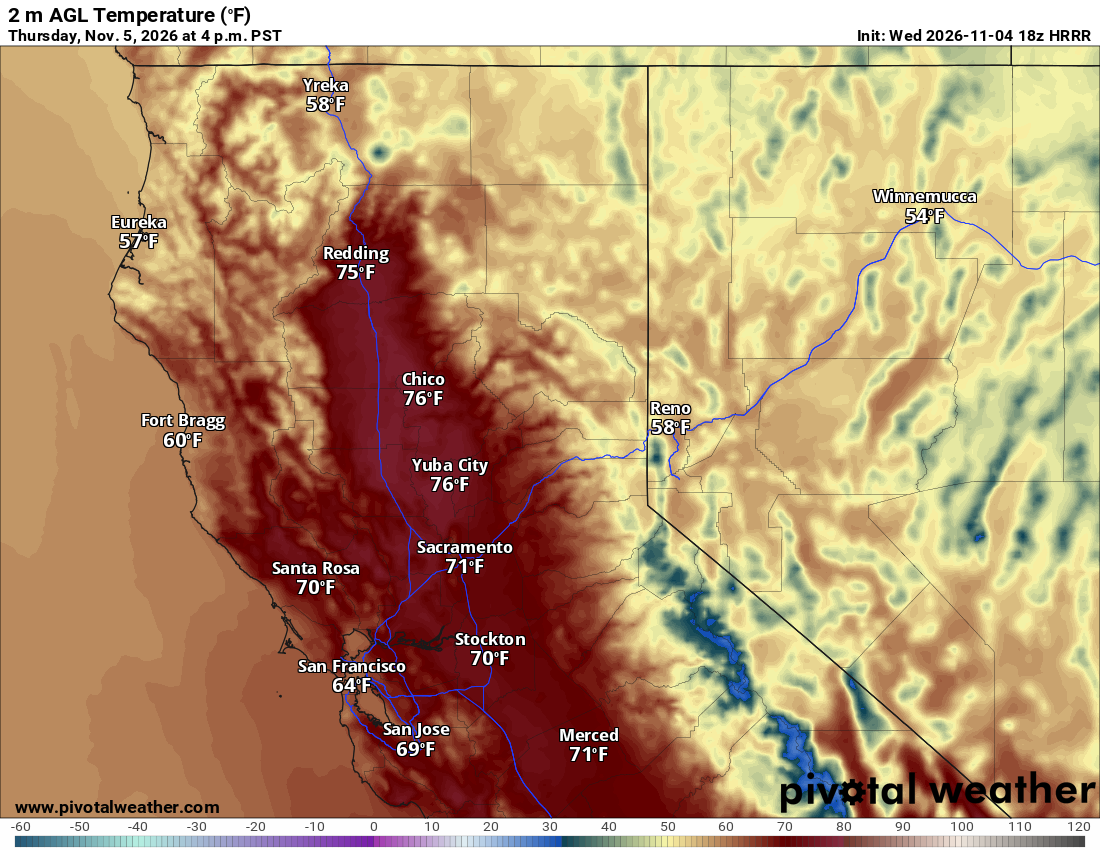
What the map shows
The temperature you would feel outside at the forecast time, not the day's high or low. A second version adds a bold 32°F line and county borders.
How to read the colors
Blues and purples are below freezing; greens and yellows are mild; oranges and reds are hot.
Common mistakes
- Treating a single hour as the daily high or low.
- Ignoring known model warm or cold biases near snow cover or in valleys.