
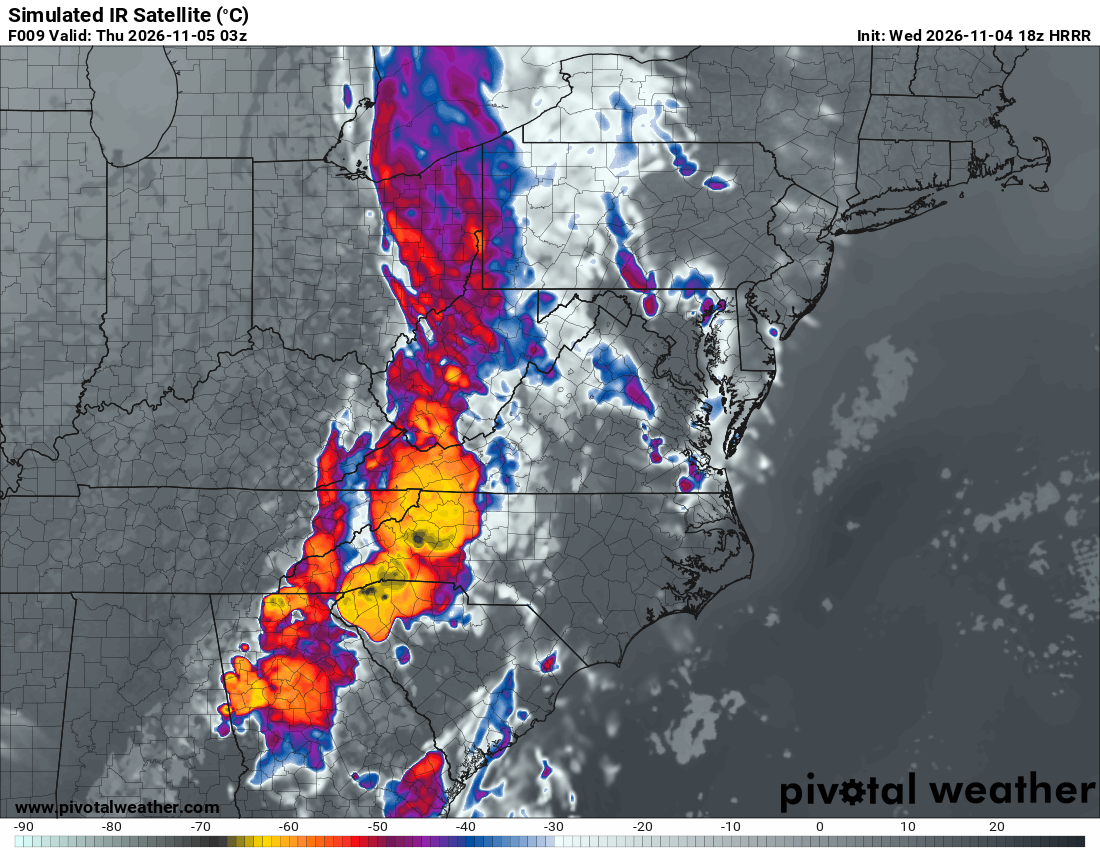
What the map shows
Model-simulated infrared brightness temperatures highlight cloud tops and the surface where skies are clear. Very cold cloud tops can help identify deep thunderstorms and broad high-cloud shields; this is a forecast, not an observed satellite image.
How to read the colors
Read the temperature scale at the bottom. In this example, gray shades are warmer, while blue, purple, red and yellow highlight progressively colder cloud tops. Yellow areas near −60°C represent very cold, high cloud tops.
Common mistakes
- Confusing the simulated image with a real-time satellite observation.
- Treating every cold cloud top as severe weather; check instability, wind shear and radar forecasts too.