
Back to Learning Center

Learning Center / Model Parameters / Surface & Precipitation

Surface Anomalies (Temperature & PWAT)

How unusual temperature or moisture is compared with normal.

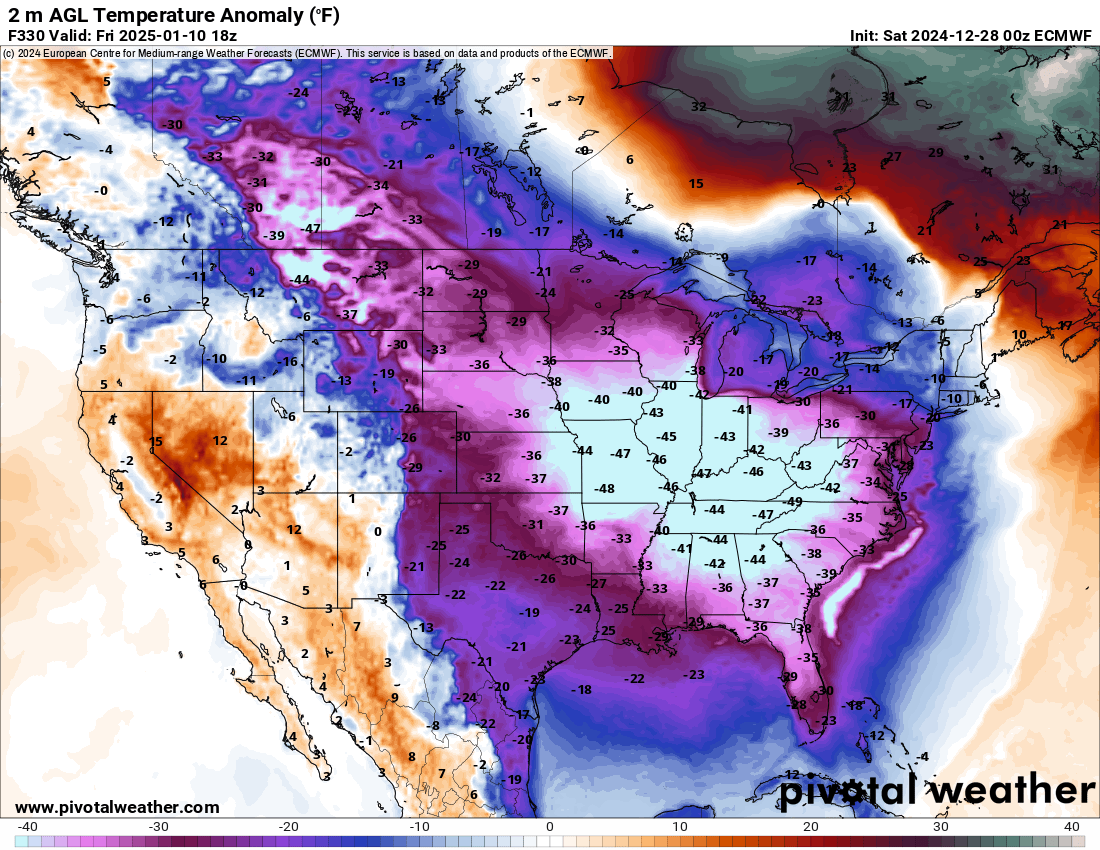
ECMWF 2 m temperature anomaly map of North America showing temperatures 30 to 45 degrees Fahrenheit below normal across the eastern United States
2 m temperature anomaly (°F) showing a deep Arctic outbreak over the eastern U.S., from the ECMWF model. Init: Sat 2024-12-28 00z, valid Fri 2025-01-10 18z.

What the map shows

Unusually warm, cold, wet or dry air for the time of year.

How to read the colors

Reds above normal, blues below normal; white is near normal.

Common mistakes

  • Reading a large anomaly as extreme weather — 10°F above normal in January is still cold in many places.

Key terms

Open in Pivotal Weather