
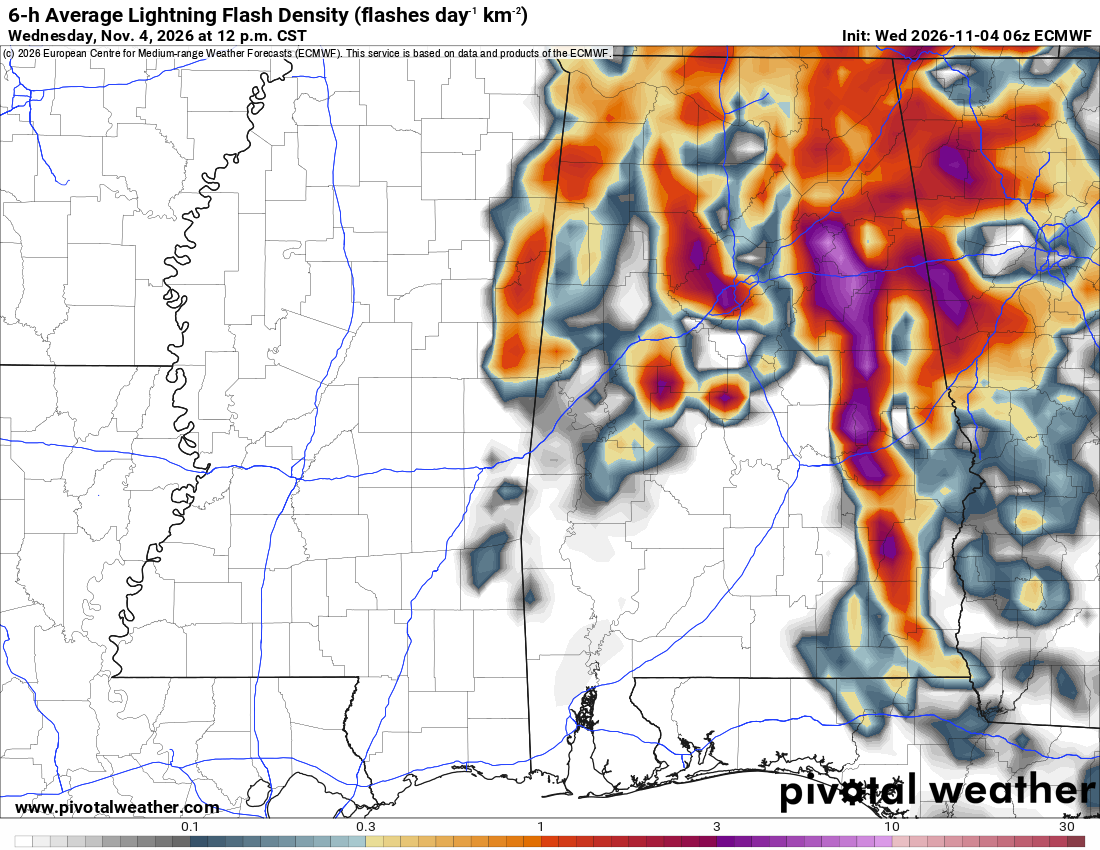
What the map shows
Where thunderstorms may produce more frequent lightning. This ECMWF example shows a six-hour average flash density expressed as a daily rate per square kilometer, not the total number of flashes during those six hours. It is a model forecast, not observed lightning or a probability of a strike at a particular location.
How to read the colors
Read the scale below the map: gray and blue indicate lower flash densities, yellow and orange higher densities, and red and purple more concentrated lightning activity. The labeled scale runs from 0.1 to 30 flashes/day/km²; white areas have little or no shaded activity.
Common mistakes
- Reading the daily-rate units as a six-hour flash total, or as a percentage probability.
- Assuming higher flash density guarantees tornadoes, hail or damaging wind; check other storm ingredients.
- Using a forecast map to decide it is safe outdoors; follow current warnings and seek shelter when thunder is heard.