
Back to Learning Center

Learning Center / Model Parameters / Severe Weather

CAPE with Hodographs

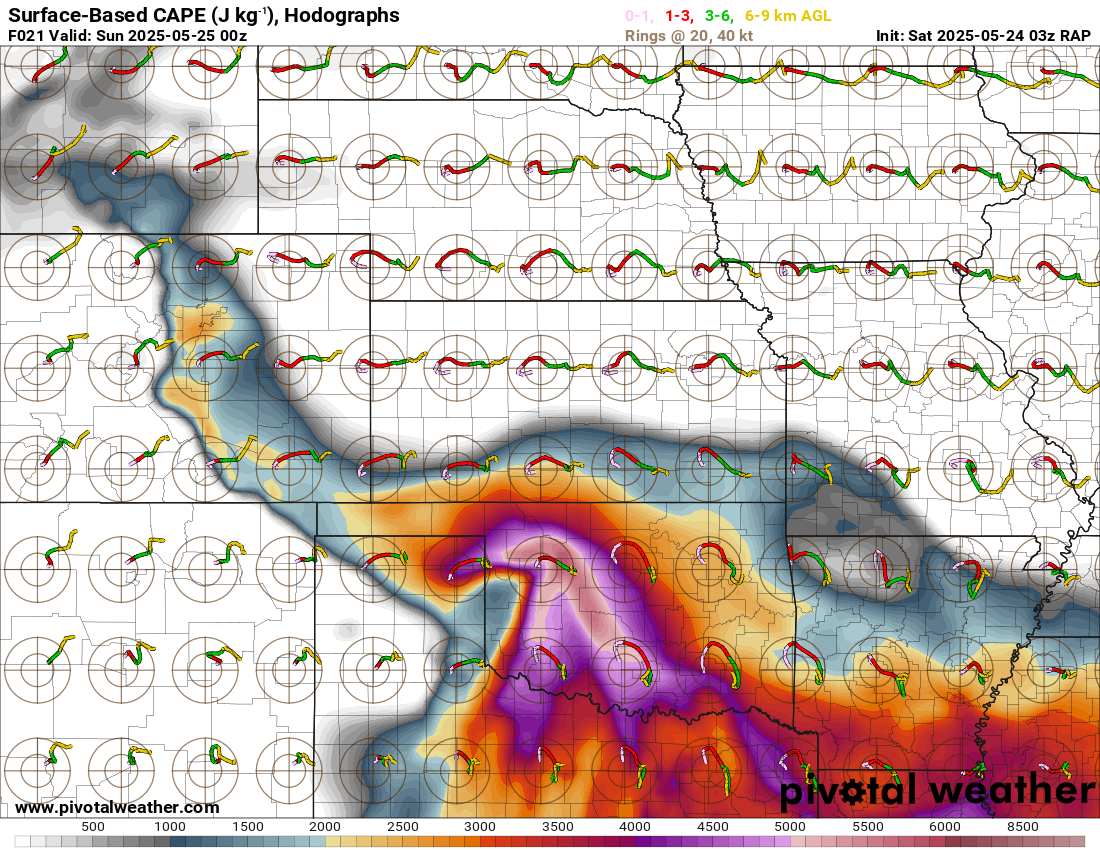
Instability shading with small wind-profile plots across the map.

RAP surface-based CAPE map of the southern Plains with hodographs plotted across the map, showing 4000+ J/kg over north Texas with curved hodographs indicating rotating storms
Surface-based CAPE (J/kg) with hodographs overlaid, showing extreme instability and curved wind profiles across the southern Plains, from the RAP model. Init: Sat 2025-05-24 03z, valid Sun 2025-05-25 00z.

What the map shows

Both storm fuel and how winds turn with height, at a glance.

How to read the colors

CAPE shading underneath; curved hodographs suggest rotating storms.

Common mistakes

  • Reading tiny hodographs too precisely — open a sounding for detail.

Key terms

Open in Pivotal Weather