
Back to Learning Center

Learning Center / Model Parameters / Winter Weather

Ice Accumulation

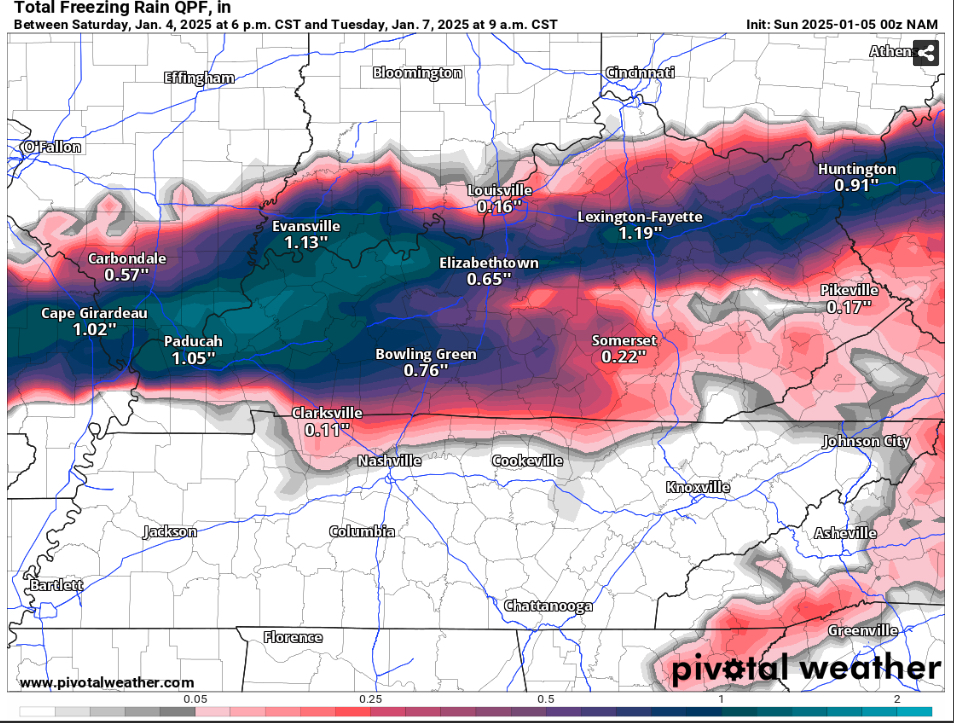
Freezing rain totals, as raw liquid or as estimated ice on surfaces.

Total freezing rain map of Kentucky and southern Illinois showing over an inch of ice from Evansville to Lexington
Total freezing rain (in) during the January 2025 ice storm, with over an inch across Kentucky. Init: Sun 2025-01-05 00z, accumulation through Tue 2025-01-07 9 a.m. CST.

What the map shows

Where icing could bring down trees and power lines (about 0.25 in or more).

How to read the colors

Pinks and purples, darker for heavier ice.

Common mistakes

  • Reading raw freezing-rain totals as ice thickness — some runs off. The FRAM version estimates what actually sticks.

Key terms

Open in Pivotal Weather